Analytics & KPIs
RepairOps provides comprehensive analytics and dashboards to track shop performance in real-time. Monitor revenue, throughput, turnaround time, QC quality, and technician performance. Pro tier unlocks AI insights and PDF reports.
Shop-Level Dashboards Starter
Section titled “Shop-Level Dashboards ”KPI Dashboard
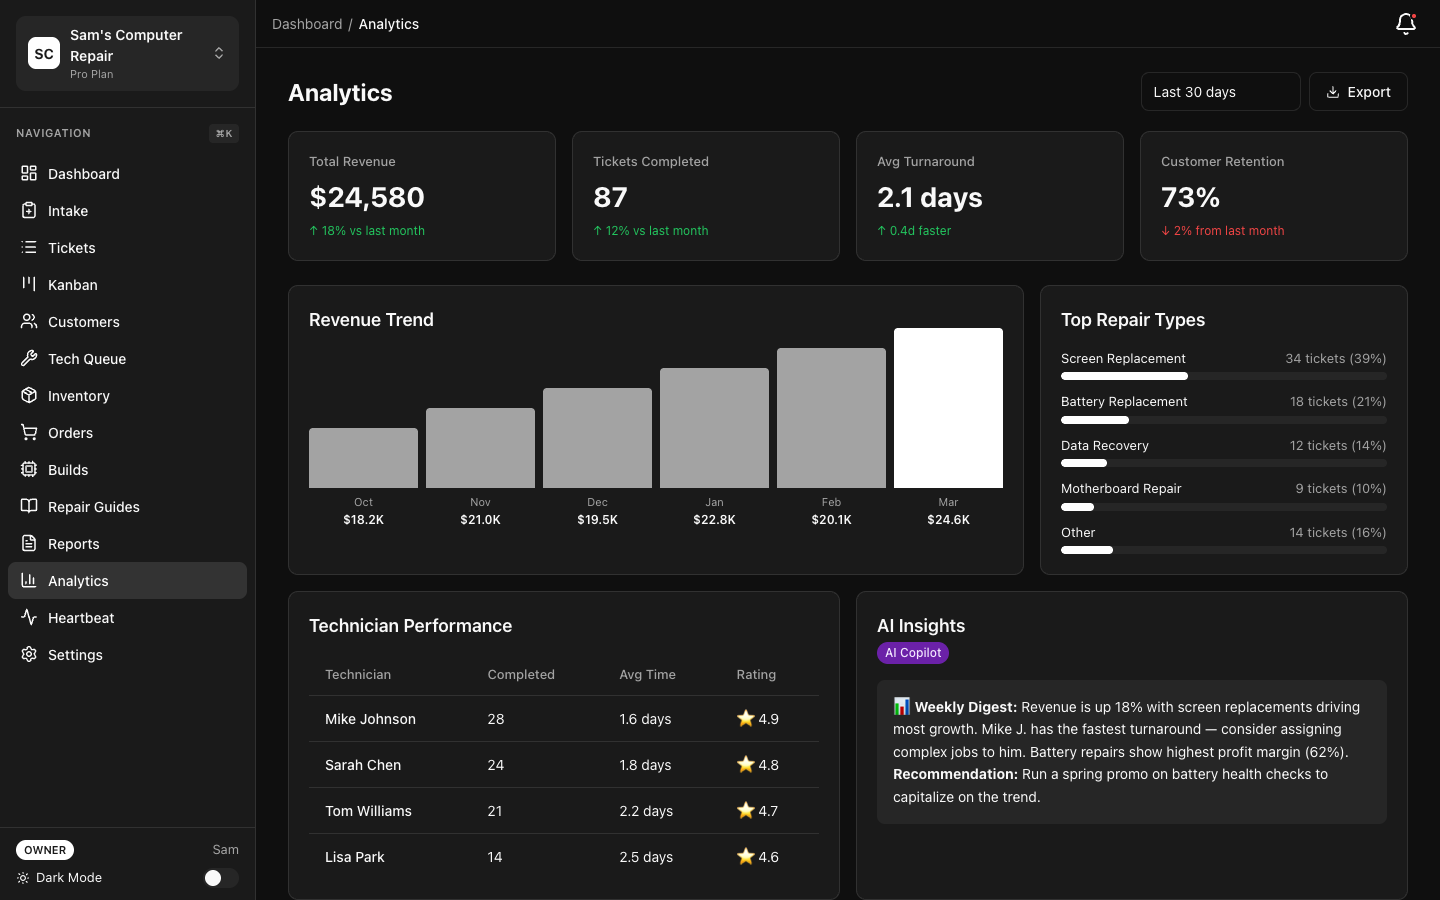
Section titled “KPI Dashboard”The main KPI Dashboard displays key performance indicators for your shop:
| KPI | What It Measures |
|---|---|
| Revenue | Total repair revenue (labor + parts) this month |
| Throughput | Tickets completed this month |
| Average Turnaround | Days from intake to pickup (median) |
| QC Pass Rate | % of devices passing QC on first attempt |
| Customer Satisfaction | Average rating (if using feedback plugin) |
| Labor Margin | Labor revenue as % of total revenue |
| Parts Margin | Parts revenue as % of total revenue |
| Overdue Tickets | Tickets past expected completion date |
View: Navigate to Analytics → Shop Dashboard
Each KPI shows:
- Current value
- Trend (up/down/flat) vs. last month
- Sparkline chart (7-day rolling view)
- Comparison to shop average (if multiple techs)

Timeline View
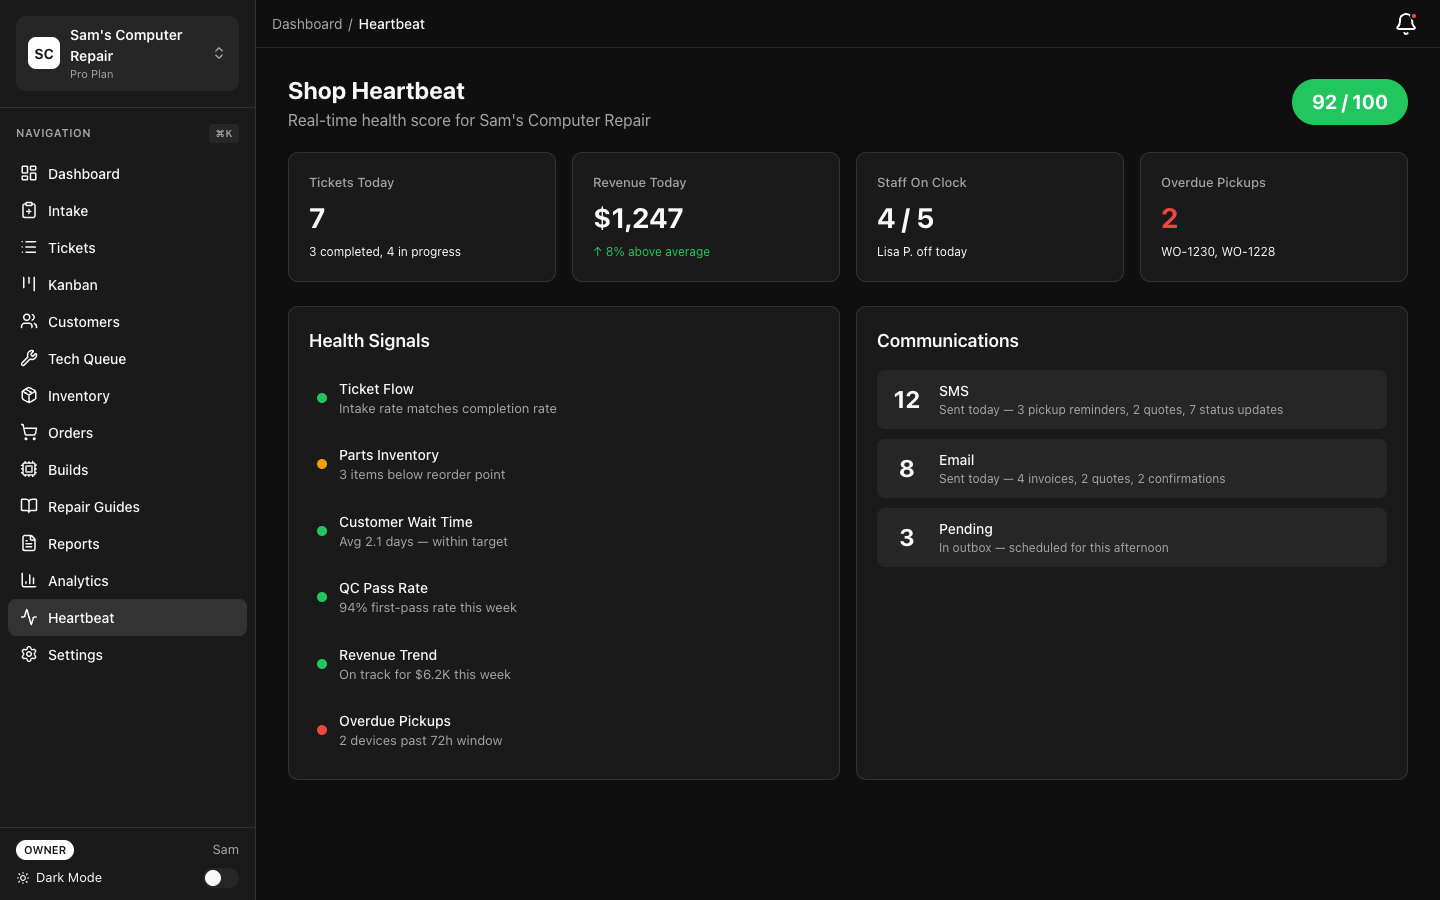
Section titled “Timeline View”See shop activity across a selected date range:
- Click Analytics → Timeline
- Select date range (7 days, 30 days, quarter, custom)
- View:
- Daily revenue trend
- Tickets completed each day
- Average turnaround over time
- QC pass rate trend
- Busiest days/slowest days
Technician Dashboards
Section titled “Technician Dashboards”Personal Dashboard
Section titled “Personal Dashboard”Each technician can view their own performance:
- Click Analytics → My Performance
- View your 7-day rolling stats:
- Tickets completed
- Average turnaround
- Average job value
- QC pass rate
- Customer feedback rating
- Hours worked (if time tracking enabled)
Comparison view shows how your metrics compare to shop average (anonymously).
Tech Performance (Manager View)
Section titled “Tech Performance (Manager View)”Managers can view all technician performance:
- Analytics → Technician Performance
- Select date range
- View table sorted by metric (default: revenue)
- Sparklines show 30-day trend for each tech
Key metrics:
- Revenue generated
- Tickets completed
- Average job value
- QC pass rate
- Customer satisfaction
- No toxic leaderboards — focus is on trends and improvement, not ranking
This view helps identify training needs (e.g., tech with low QC pass rate or high turnaround).
Data Collection & Snapshots
Section titled “Data Collection & Snapshots”RepairOps automatically collects KPI data via a nightly snapshot worker:
When: Every night at 2 AM (shop timezone)
What’s collected:
- Daily revenue (by labor, parts, services)
- Tickets completed
- Avg. turnaround
- QC pass rate
- Time spent by category (diagnostics, repair, QC)
- Customer satisfaction scores
- Technician performance metrics
Why snapshots: Instead of recalculating metrics every time you load the dashboard, RepairOps pre-calculates and stores snapshots. This makes dashboards fast (instant loading) and enables time-series analysis.
Data retention: Snapshots are kept for 2 years (26 weeks + historical archive).
Advanced Analytics Pro
Section titled “Advanced Analytics ”AI Manager Insights
Section titled “AI Manager Insights”Every week, receive automated insights powered by AI:
When: Every Monday at 8 AM (manager’s timezone)
What you receive:
- Top 3 repair categories this week
- Technician performance trends
- Issues flagged for improvement
- Customer sentiment summary
- Recommended actions (e.g., “High QC failure rate on GPU repairs — consider additional training”)
Where to access:
- Analytics → Manager Insights
- View current week’s report
- View past weeks
- Insights are also emailed to all managers
This is powered by your configured AI provider and requires AI credits.
Documentation Quality Score
Section titled “Documentation Quality Score”RepairOps scores the quality of repair documentation:
Score factors:
- Completeness (diagnostics logged, findings documented, actions taken noted)
- Clarity (spelling, grammar, technical accuracy)
- Evidence (photos, part numbers, test results attached)
- Consistency (standard terminology, good formatting)
View:
- Analytics → Quality Metrics
- Select Documentation Score
- Browse shop average and individual tech scores
- Drill into specific tickets to see what improves scores
Use case: Identify team members who need writing/documentation training. Celebrate high-quality documentation.
PDF Export
Section titled “PDF Export”Generate professional reports for stakeholders:
- Analytics → Reports
- Select date range and metrics to include
- Click Generate PDF
- Customizable sections:
- Executive summary
- Revenue analysis
- Technician performance
- KPI trends
- Recommendations
Export includes charts, tables, and executive summary. Useful for:
- Investor presentations
- Board meetings
- Year-end reviews
- Loan applications


Tech Achievements & Badges
Section titled “Tech Achievements & Badges”Celebrate technician milestones with achievements:
| Badge | Criteria |
|---|---|
| Speedster | 10 consecutive tickets with < 2-day turnaround |
| Quality Master | 30 consecutive days without QC failure |
| Expert | 100 tickets repaired in a category (e.g., “GPU Expert”) |
| Customer Favorite | 10 consecutive 5-star customer reviews |
| Night Owl | 20 after-hours repair sessions |
Achievements are:
- Displayed on technician profiles
- Emailed to recipient
- Announced in team chat (if enabled)
- Tracked on manager dashboard
Achievements are meant to be encouraging, not competitive. No “worst” badges or negative comparisons.
Filters & Drill-Down
Section titled “Filters & Drill-Down”All dashboards support filtering:
By date:
- Today, yesterday, last 7/30/90 days, custom range
By technician:
- Individual, team, entire shop
By category:
- Device type (laptop, desktop, phone, etc.)
- Issue type (hardware, software, damage, etc.)
- Repair complexity (simple, moderate, complex)
By status:
- Completed, in progress, overdue
Click a metric to drill down. For example:
- Click Revenue → See breakdown by category
- Click a category → See specific tickets and technicians
Exporting Data
Section titled “Exporting Data”Export analytics data for use in external tools:
Supported formats:
- CSV (import to Excel, Google Sheets, accounting software)
- JSON (for custom integrations)
- PDF (reports and executive summaries)
What can be exported:
- Daily KPI snapshots (date range selectable)
- Technician performance table
- Customer satisfaction data
- Revenue breakdown by category
Navigate to Analytics → Export to select format and data range.
Tier Availability
Section titled “Tier Availability”| Feature | Starter | Pro | Enterprise |
|---|---|---|---|
| Shop KPI dashboard | ✓ | ✓ | ✓ |
| Timeline view | ✓ | ✓ | ✓ |
| Personal tech dashboard | ✓ | ✓ | ✓ |
| Tech performance (manager) | ✓ | ✓ | ✓ |
| Nightly snapshots | ✓ | ✓ | ✓ |
| AI manager insights | — | ✓ | ✓ |
| Documentation quality score | — | ✓ | ✓ |
| PDF export | — | ✓ | ✓ |
| Tech achievements | ✓ | ✓ | ✓ |
| Drill-down filtering | ✓ | ✓ | ✓ |
| Data export (CSV/JSON) | ✓ | ✓ | ✓ |
Best Practices
Section titled “Best Practices”Review KPIs weekly — Don’t wait for monthly reports. Catch trends early and act on them.
Use dashboards to identify training needs — Low QC pass rate? High turnaround? It’s a training opportunity, not a failure.
Share insights with the team — Celebrate wins. If you hit 95% QC pass rate, let everyone know.
Set realistic goals — Track trends over months, not days. One slow week doesn’t mean the shop is declining.
Archive old reports — Keep final monthly reports for historical reference and tax/audit purposes.
Related Features
Section titled “Related Features”- AI Gateway — Powers AI manager insights
- POS Terminal — POS revenue included in KPI calculations
- Plugin System — Google Reviews plugin feeds customer satisfaction data